Waves - Measurements
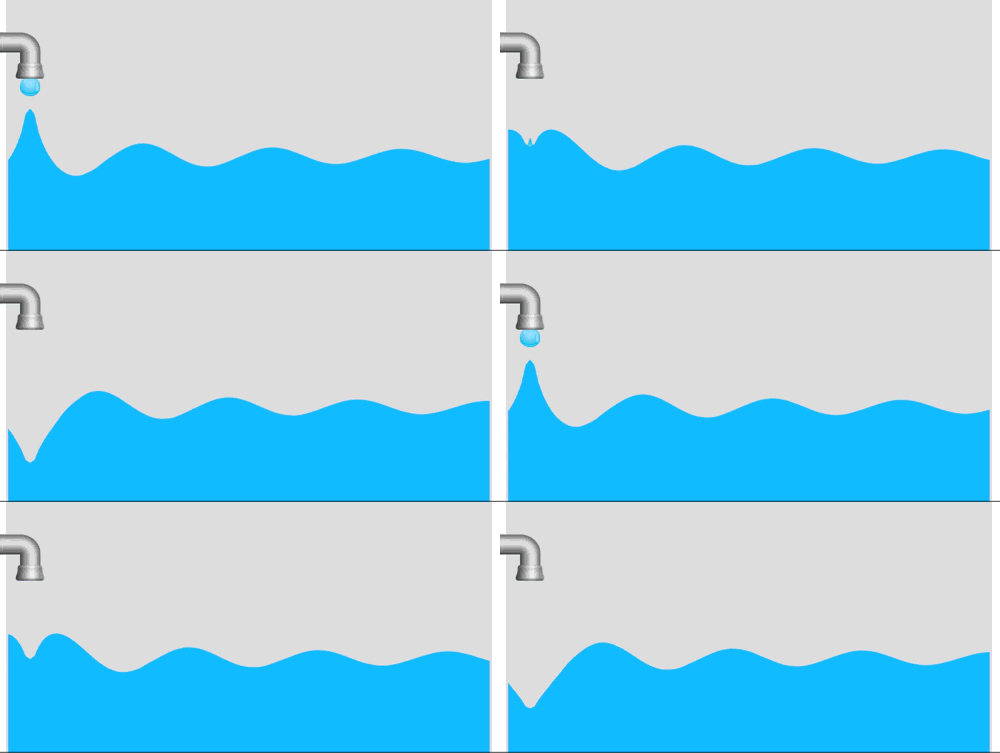
Last class/page, you described waves using your own words. You made pictures, and then wrote descriptions.
Now, you get to learn the science words.
EQ - How do I describe frequency, wavelength, and speed.
Know - Science definitions of frequency, wavelength, and speed.
Do - Measure the properties of waves in PHET simulations.
Introduction
- Frequency is how fast the wave wiggles
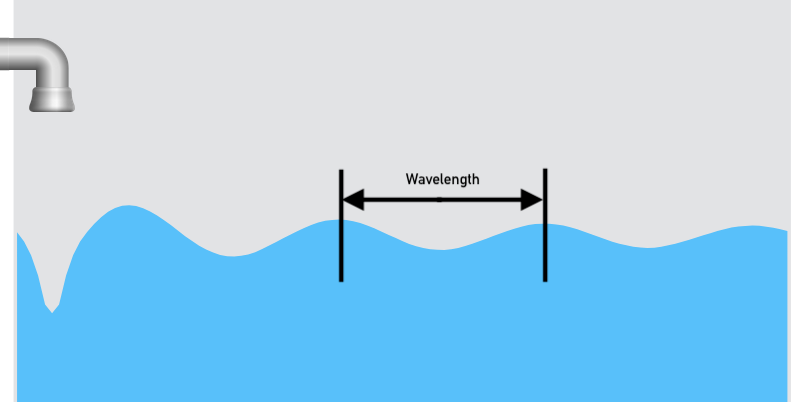
- Wavelength is how far it is from one part of a wiggle to the same part on the next wiggle.
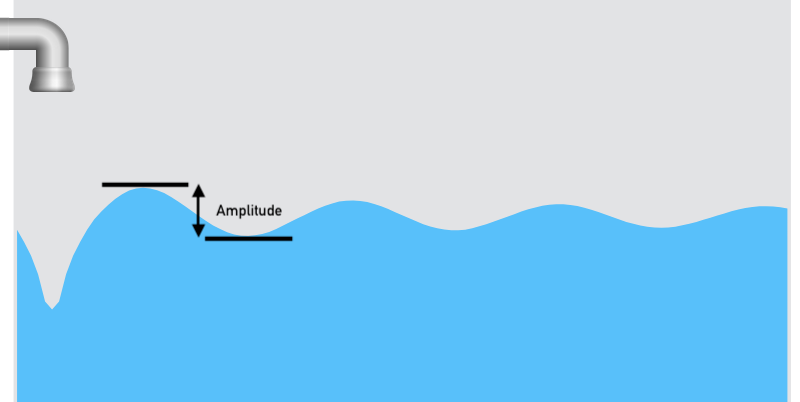
- Amplitude is how big the wiggle is from its highest point to its lowest point.
- Speed is how fast the wave travels.
Instructions
Your goal out of today is have an understanding of what frequency, wavelength, amplitude, and wave speed is.
Copy down ANY and ALL information that you need in your lab notebook so that you can use frequency, wavelength, amplitude, and wave speed to describe waves.
Table of contents
- Vocabulary - Definitions and Examples
- Activity - Waves on a string
- Water, Sound, and Light waves
- Conclusion
- Prep
Vocabulary - Definitions and Examples
Turns out there are only 4 things required to describe a wave. Frequency, wavelength, amplitude, and speed.

| Property | Definition | Symbol | Unit |
|---|---|---|---|
| Frequency | \(\text{Frequency} = \frac{\text{# of wiggles}}{\text{Time in seconds}}\) | f | Hertz - Hz - \(\frac{1}{second}\) |
| Wavelength | Length from one point on a wave to the same point on the next wave | \(\lambda\) | meters |
| Amplitude | Height from the highest part to the lowest part | A | Depends on the wave… |
| Speed | Speed is the frequency times the wavelength | c | \(\frac{m}{s}\) |
Frequency - f
Frequency, is how many times the wave wiggles in a given period of time.
\[\text{Frequency} = \frac{\text{# of wiggles}}{\text{Time in seconds}}\]The units are then just \(\text{Hz}=\frac{1}{\text{s}}\)
To measure frequency there are two ways to do it depending on the picture you have.
Graph with time on the x-axis
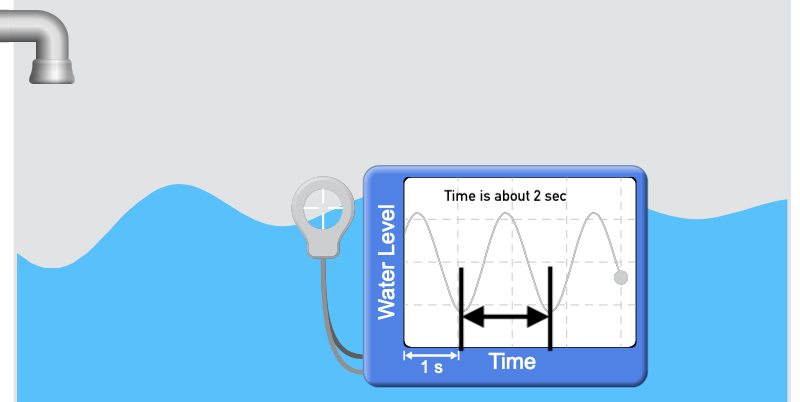
If you have a graph of a wave with time on the x-axis. The frequency is:
\[\frac{1}{\text{the time from one peak of the wave to the next peak}}\]
Video or moving picture
Simply count the number of high (or low) points that pass in a given point in time. Look at the video below. There is about 1 wiggle every 2 seconds, so the frequency is:
\[f=\frac{\text{1 wiggle}}{\text{2 seconds}}=0.5 Hz\]
Wavelength - \(\lambda\)
First things first, \(\lambda\) (pronounced lamb-da, the greek letter L), is the symbol used for wavelength.
To measure the wavelength just take a ruler and measure from one point to the same point on the next wave. The easiest is usually to go from one peak to another peak.

Amplitude
To measure the amplitude, all you have to do is figure out the distance from the top to of one peak, to the next lowest. For the units, you’ll have to look at the y-axis.

Speed
Wave speed is just the product of frequency and wavelength and represents how fast the wave is moving. Think of a surfer on a wave, the speed the surfer is moving, is the speed of the wave.

Wave Equation
And now, we have the wave equation:
\[\text{Wave speed} = \text{Frequency}\times\text{Wavelength}\] \[c = f \times \lambda\]Activity - Waves on a string
By now you should have played with the yarn on the table. Where it was hard to measure things accurately with yarn on a table, you can measure things really well on a computer that has a pause button.
- Setup
- Mess with the damping and the tension sliders that are at the bottom of the simulation until the string behaves like the yarn did.
You don’t have to know what they do, but you should be able to get it close. - Once you have it looking right, switch from the ‘manual’ to the ‘oscillate’ in the selection box in the top left. This will allow you to pause it easily for your measurements.
- Mess with the damping and the tension sliders that are at the bottom of the simulation until the string behaves like the yarn did.
- Start the oscillator and then pause it.
- Change the frequency, restart the oscillator, wait a bit, then pause it again.
- Change the frequency, restart the oscillator, wait a bit, then pause it again.
- You now have everything that you need to calculate speed!
- Now that you have some speeds, compare them!
- Change the tension to make it lower.
- Since you changed something, another comparison is in order!
- One more question,
Water, Sound, and Light waves
Here is the deal, you are very familiar with waves on water, kind of familiar with sound as waves, and probably not at all used to thinking of light as waves. In the following questions, you’ll be guided into deeper unknowns little by little, so stick with us!
Water waves
- Setup
- Start with the ‘Water’
- Click on the ‘Side View’ in the lower left.
- Click the ‘green button’ on the spout to start it dripping.
- Calculate the frequency
- Pull the timer out of the tool box on in the upper right.
- When a drop comes out, click start.
- Stop the timer when the 10th drop comes out.
- To calculate the frequency, divide the number of drops by the time it took.
- Measure the wavelength
- Pause the simulation by pressing the ‘pause’ button.
- Pull the tape measure out of the tool box. The tape measure measures from the little ‘+’ sign to the other little ‘+’ sign.
- Repeat steps 2 and 3 for a different frequency
- Now time for the speed.
- Now that you have the speeds, time for the comparison.
- Side versus top view - Switch back and forth between the top and side view.
Sound Waves
- Click the green button on the speaker to start the sound waves.
- Comparison time!
- Click the ‘Play tone’ box over on the right hand side just below the sliders.
- Slide the frequency down to ‘min’
- Slide the frequency up to ‘max’
- Measuring the frequency, wavelength, speed for ‘min’
- Set the frequency to ‘min’
- Get out the timer from the toolbox.
- When a bright white spot appears at the speaker, start the timer.
- With the timer running, count up 10 white spots, stopping the timer when the 10th spot appears.
- You multiply by a 1000 because the timer is in ms so that you can ‘see’ the sound wave. Sound waves are much, much, to fast to see so this simulation slows them down by a factor of a 1000.
- Once you have measured your frequency, you can now measure the wavelength.
- Let the screen fill with sound waves, and then press pause.
- Get the tape measure out of the toolbox.
- For this, the wavelength is either one bright spot to the next bright spot, or one dark spot to the next dark spot.
- Repeat Step 4 with the ‘max’ frequency.
- And, at last for the comparison:
Light
For this, you are going to repeat the measurement steps that you did for sound to get the frequency, wavelength, and speed for three different colors. Note, to calculate the frequency you’ll need to take the number of colored spots, divided by the time it took, times \(10^{15}\) because the timer is in femto-seconds. Yes, light is that much faster than sound.
| Data | Color 1 | Color 2 | Color 3 |
|---|---|---|---|
| Color Name | |||
| # of spots | 10 | 10 | 10 |
| Time it took in fs | |||
| Frequency (number of spots, divided by time, times \(10^{15}\)) | |||
| Wavelength in nm (what the ruler reads) | |||
| Wavelength in m | |||
| Speed of the wave (frequency \(\times\) wavelength) |
Conclusion
Answer the following in your lab notebook in complete sentences.
Prep
- None, all work is done through PHET simulations.