Introduction to Help
insert a video here
Table of contents
- Introduction to Help
- 1 - Lab Introduction
- 2 - Materials Setup Procedure
- 3 - Data
- 4 - Observations & Conclusions - Q1
- 5 - Observations & Conclusions - Q2
1 - Lab Introduction
For this lab there are 2 questions. For each, you need to have a hypothesis, a statement of what you think the answer to the question is. Here are 2 sentence starters for the first question:
- Things have an exact size because …
- Things do not have an exact size because …
For the second question, you should first figure out what density is, hence the research.
Then, come up with your hypothesis. Here are some starters for that:
- The density changes with size because …
- The density does not change with size because …
2 - Materials Setup Procedure
For this section just write in the three things you used to complete this lab. If you weren’t here in person, then you can just take your best guess at what you did.
3 - Data
3.1 - Collecting Data
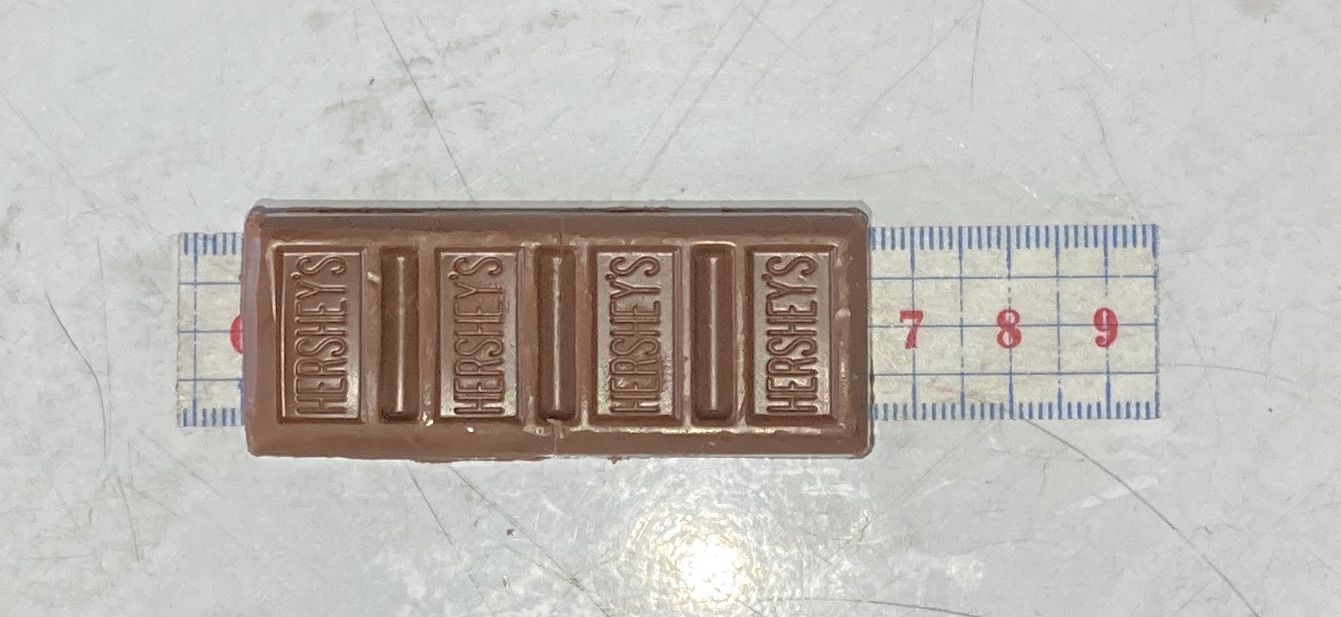
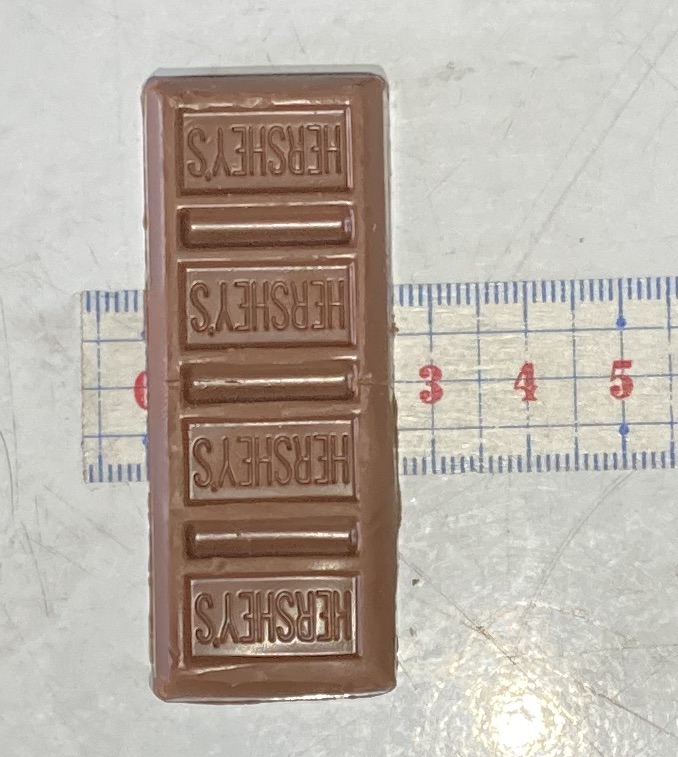
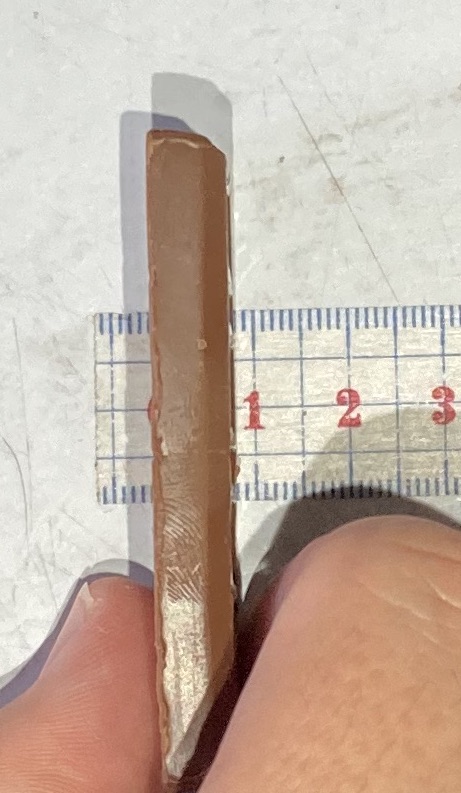
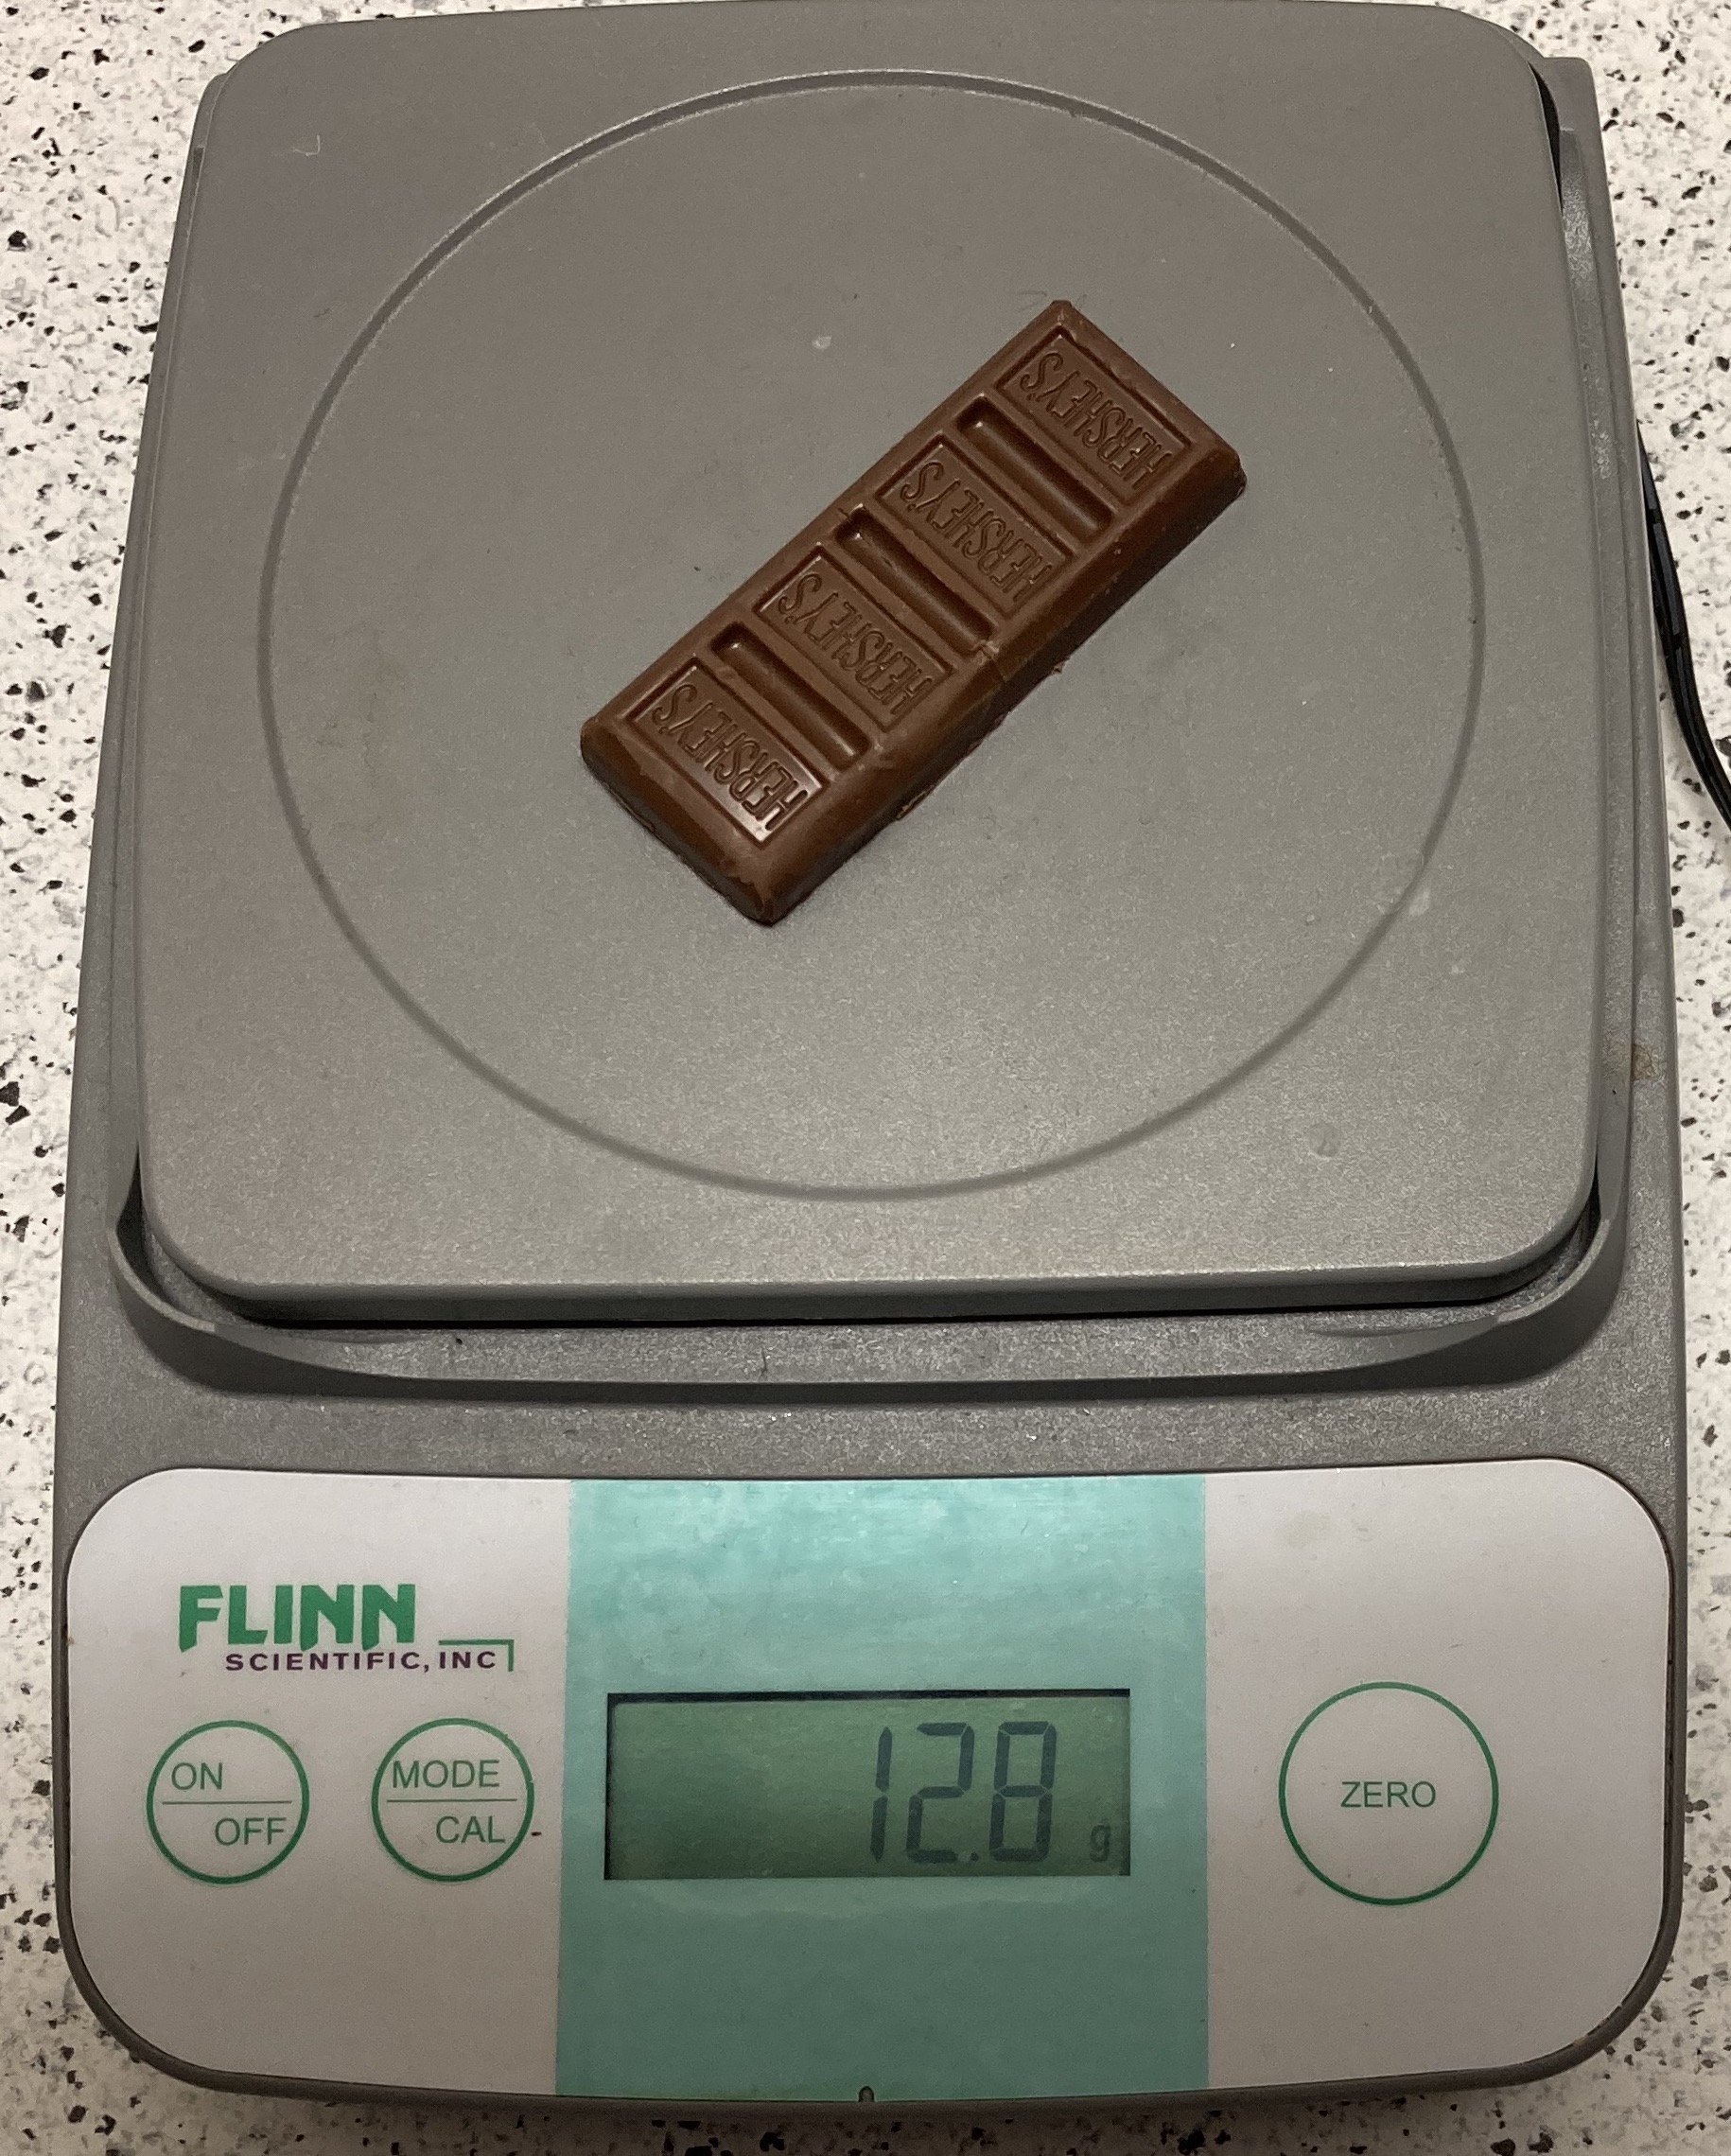
Here are pictures of the candy bar with the ruler so that you can make measurements.
3.2 - Sharing Data
Click the button below to open out the summary graph of ALL data in a new tab.
The blue dots represent data students measured off of their small candy bars. The lines represent the number Mr. Hicks measured with is much larger candy bar.
3.3 - Mr. Hicks’ Candy Bar
Below is a chart that summarizes the measurements Mr. Hicks made during his three different classes.
| Class | B1 | B3 | B5 |
|---|---|---|---|
| Length(cm) | 13.81 | 13.782 | 13.785 |
| Width(cm) | 5.58 | 5.575 | 5.578 |
| Height(cm) | 0.57 | 0.508 | 0.521 |
| Volume(cm^3) | 43.92 | 39.032 | 40.06 |
| Mass(g) | 43.69 | 44.49 | 43.69 |
| Density (g/cm^3) | 0.994 | 1.14 | 1.09 |
4 - Observations & Conclusions - Q1
Remember, the question is:
Q1 - Do things have an exact size?
4.1 - Observations
For this you are looking at the summary graph that I made. Linked below for convienence.
Look at the blue dots because those are the measurements that students made of the candy bars. Make observations about the blue dots in the graphs. Note, you don’t necessarily make notes for each, just the interesting ones.
For example, look at mass. Are those values closer together than the others? Why might that be? That is an observation you could make.
4.2 - Conclusion
Note, every student was given a fun-sized candy bar.
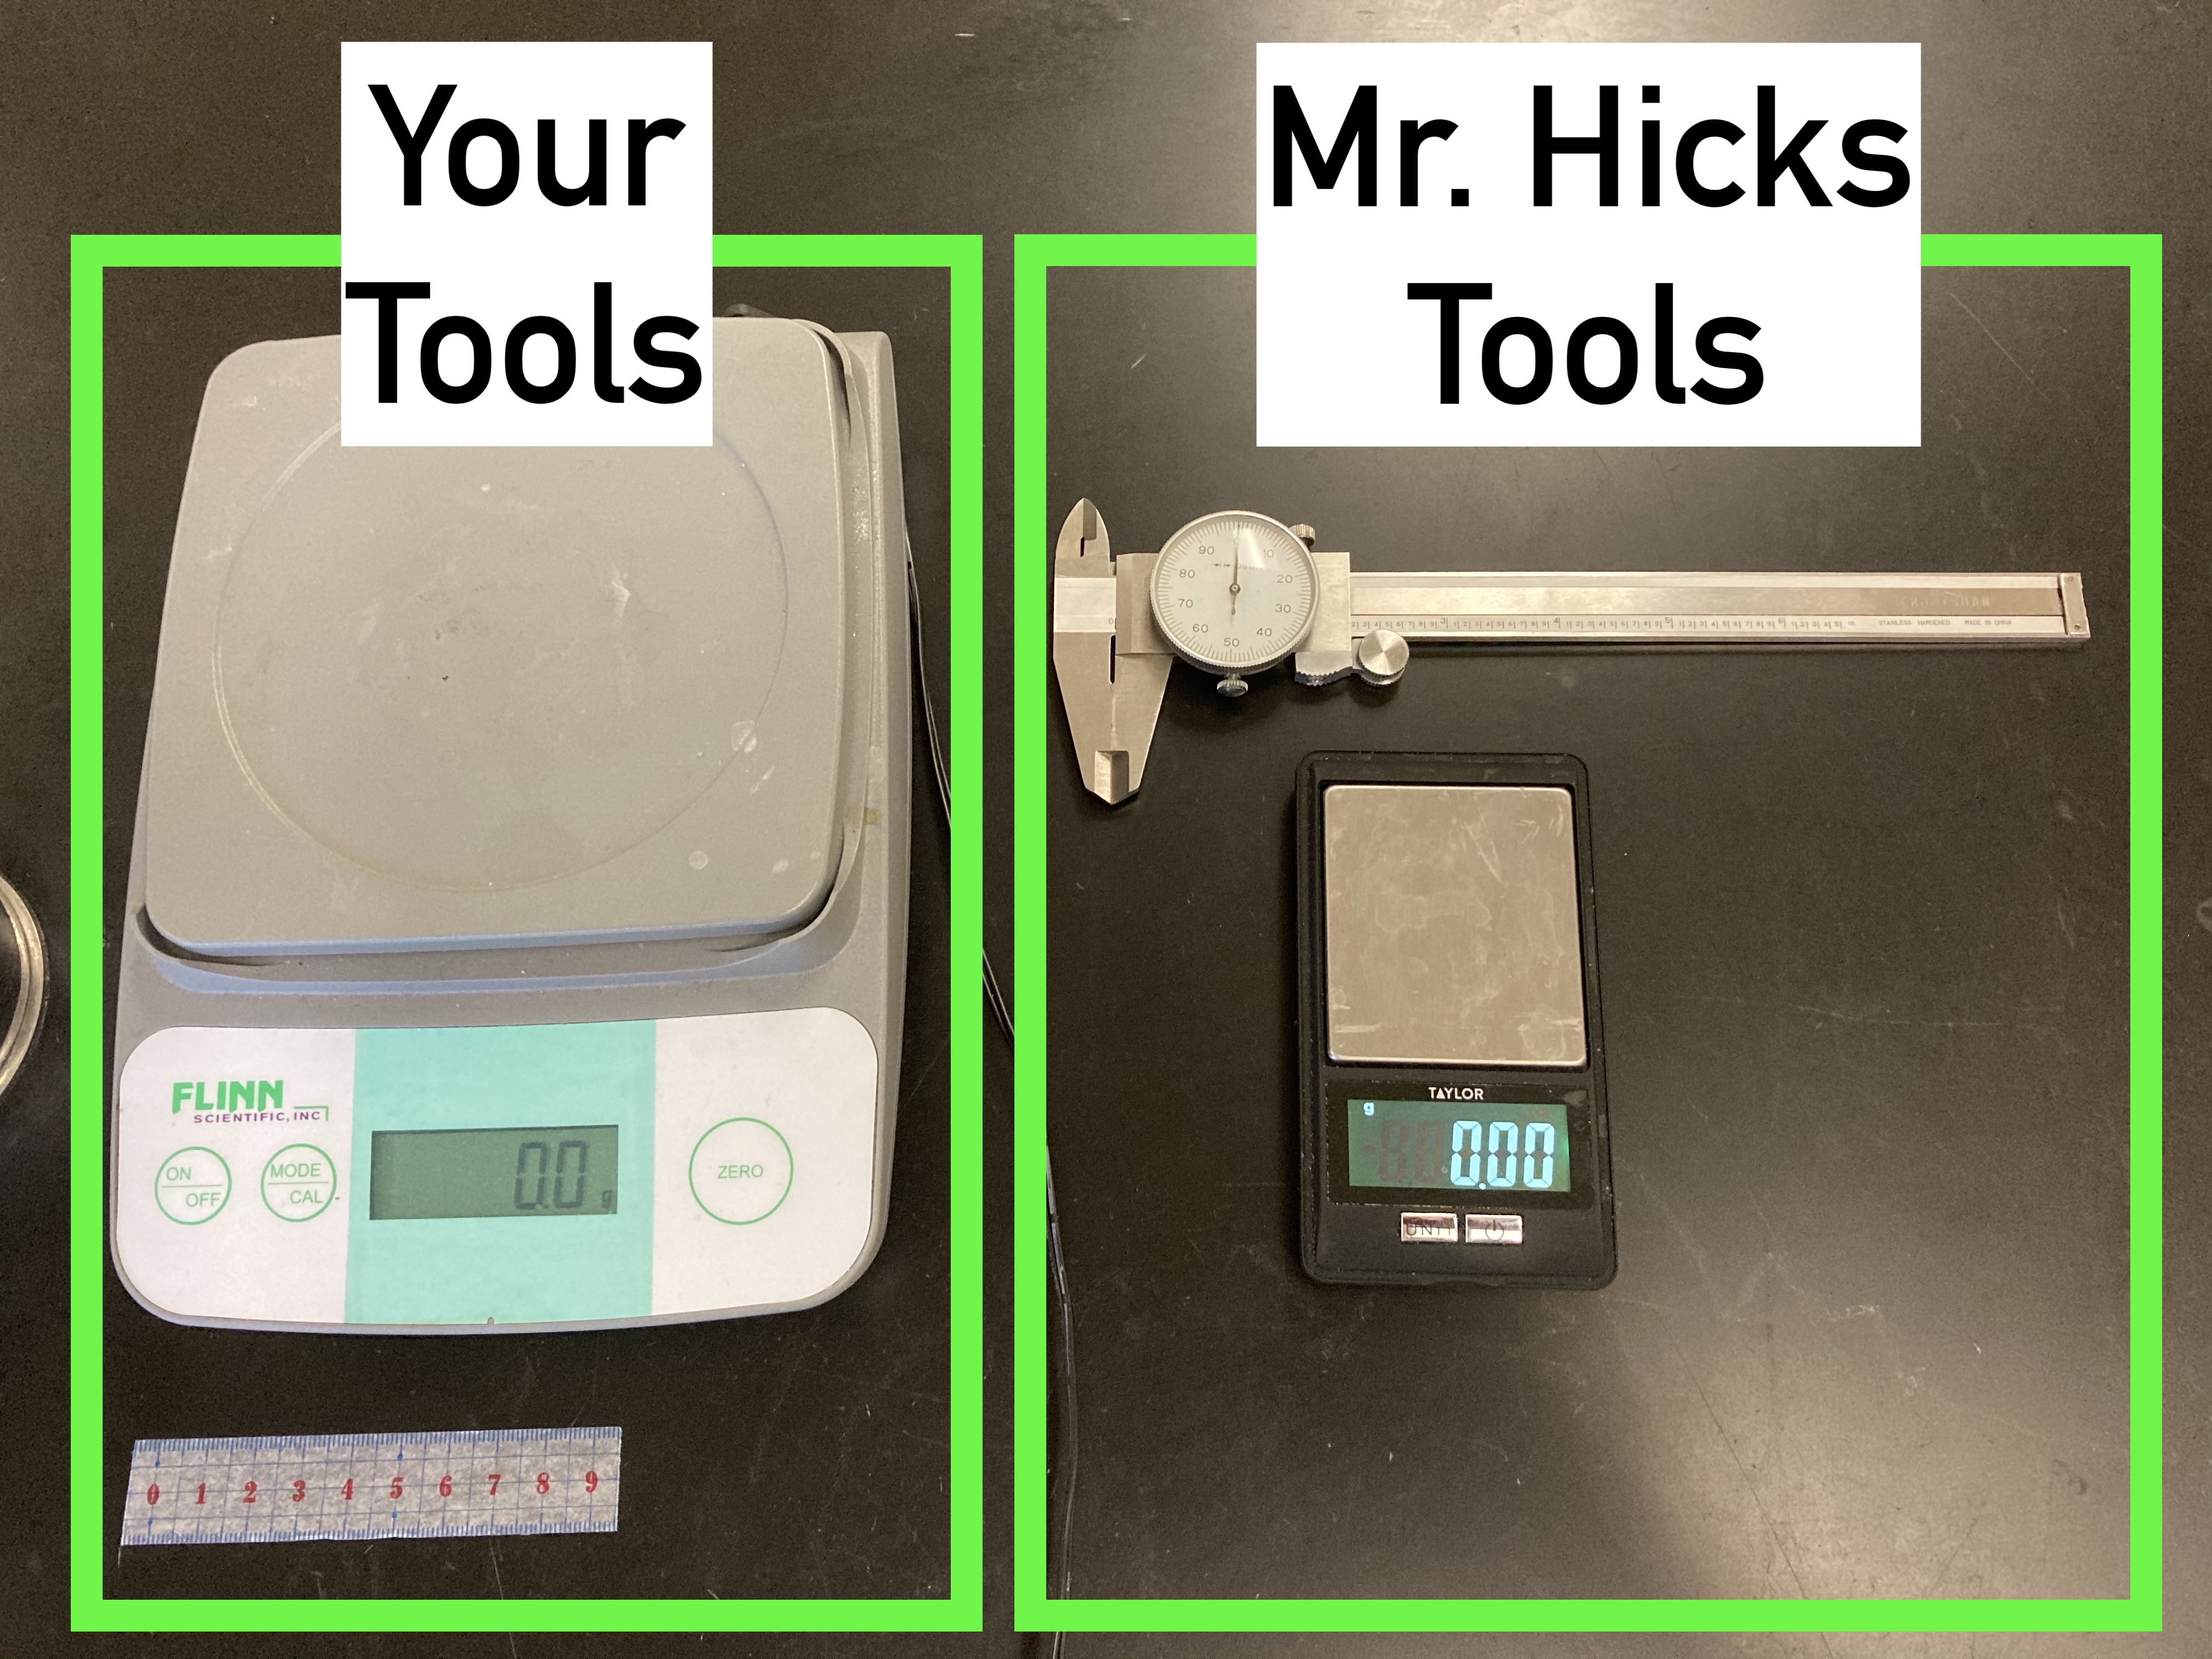
And the equipment used is shown in the picture. (Mr. Hicks has cooler toys…)
Now, for the claim, evidence, and reasoning.
- Claim is your answer, are do things have an exact size, or don’t they.
- Evidence are the observations that SUPPORT your claim. The easiest way is to just copy and paste the relevent observations from your observations above.
- Reason is what connects your observation to your claim. Explain WHY your observation supports your claim.
5 - Observations & Conclusions - Q2
Remember the question for this part is:
Q2: What happens to the density of a chocolate bar (or anything) as you decrease its size?
5.1 - Observations
Now go back and look at the last to plots in the summary, Density, and Density without outliers.
Compare the values Mr. Hicks got with his much larger candy bar (the lines), with the dots of values measured by students.
Are they the same? Are they different? That is what you are trying to answer.
5.2 - Conclusion
For the claim, evidence, and reasoning.
- Claim is your answer, are do things have an exact size, or don’t they.
- Evidence are the observations that SUPPORT your claim. The easiest way is to just copy and paste the relevent observations from your observations above.
- Reason is what connects your observation to your claim. Explain WHY your observation supports your claim.
##